|
Today, the Reserve Bank released the results of July 2026 round of its bi-monthly urban consumer confidence survey (UCCS)1. The survey collects current perceptions (vis-à-vis a year ago) and one year ahead expectations of households on general economic situation, employment scenario, overall price situation, own income and spending. The survey was conducted during July 11-20, 2026, covering 5,987 respondents across 19 major cities.
Highlights:
-
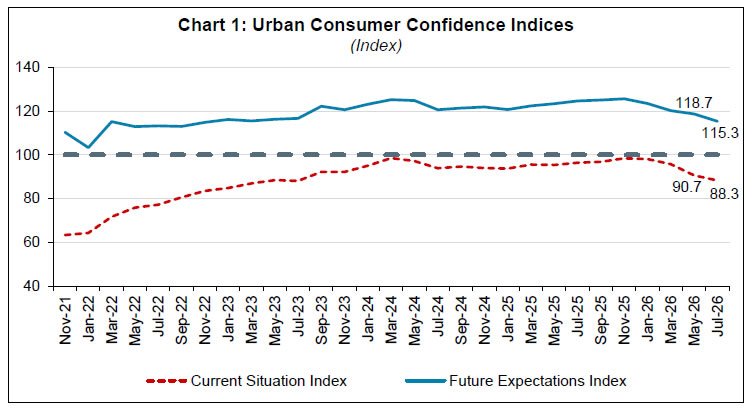
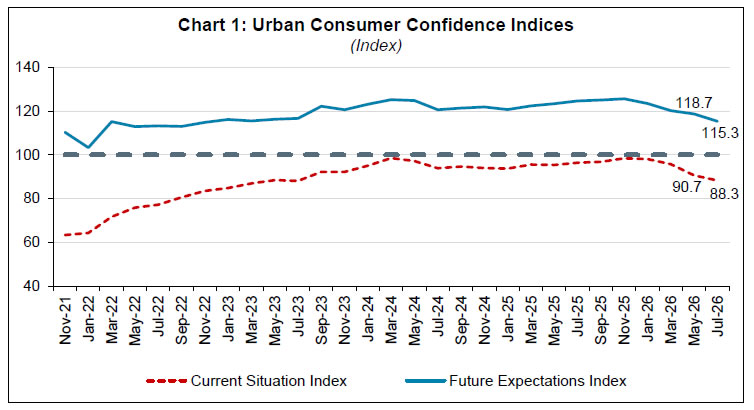
Households’ confidence for the current period moderated with the Current Situation Index (CSI)2 declined to 88.3 from 90.7 in the previous round (Chart 1).
-
Consumer optimism for the year ahead remained in positive terrain, albeit with moderation of 3.4 points in the Future Expectations Index (FEI) (Chart 1).
-
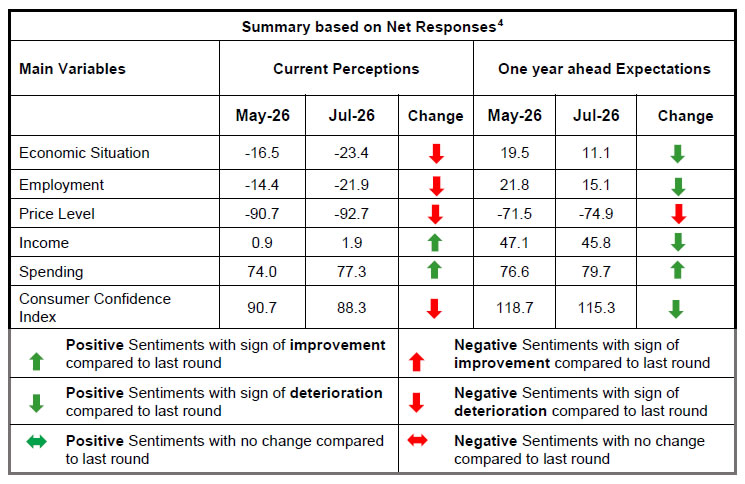
Consumers remain optimistic on income and spending outlook amidst some concerns on the economic situation and employment in this survey round (Tables 1, 2, 5 and 6).
Note: Please see the excel file for time series data3
| Table 1: Perceptions and Expectations on the General Economic Situation |
| (Percentage responses) |
| Survey Round |
Current Perception |
One year ahead Expectation |
| Improved |
Remained Same |
Worsened |
Net Response |
Will Improve |
Will Remain Same |
Will Worsen |
Net Response |
| Jul-25 |
34.2 |
27.5 |
38.3 |
-4.2 |
55.7 |
20.9 |
23.4 |
32.3 |
| Sep-25 |
37.0 |
22.1 |
40.9 |
-3.9 |
57.9 |
16.8 |
25.3 |
32.6 |
| Nov-25 |
37.2 |
23.1 |
39.7 |
-2.5 |
58.5 |
15.8 |
25.7 |
32.9 |
| Jan-26 |
36.8 |
23.0 |
40.2 |
-3.5 |
56.6 |
16.2 |
27.2 |
29.3 |
| Mar-26 |
34.5 |
22.5 |
43.0 |
-8.6 |
53.8 |
15.6 |
30.7 |
23.1 |
| May-26 |
31.2 |
21.0 |
47.7 |
-16.5 |
52.3 |
14.9 |
32.8 |
19.5 |
| Jul-26 |
27.1 |
22.3 |
50.5 |
-23.4 |
47.4 |
16.4 |
36.3 |
11.1 |
| Table 2: Perceptions and Expectations on Employment |
| (Percentage responses) |
| Survey Round |
Current Perception |
One year ahead Expectation |
| Improved |
Remained Same |
Worsened |
Net Response |
Will Improve |
Will Remain Same |
Will Worsen |
Net Response |
| Jul-25 |
32.6 |
28.2 |
39.2 |
-6.7 |
53.6 |
23.8 |
22.6 |
31.0 |
| Sep-25 |
35.3 |
23.2 |
41.5 |
-6.2 |
56.6 |
18.3 |
25.1 |
31.5 |
| Nov-25 |
35.5 |
22.7 |
41.8 |
-6.3 |
57.1 |
17.4 |
25.5 |
31.6 |
| Jan-26 |
35.8 |
22.1 |
42.1 |
-6.3 |
58.2 |
16.7 |
25.2 |
33.0 |
| Mar-26 |
34.3 |
22.3 |
43.4 |
-9.1 |
54.1 |
16.9 |
29.0 |
25.2 |
| May-26 |
31.1 |
23.5 |
45.5 |
-14.4 |
52.6 |
16.6 |
30.8 |
21.8 |
| Jul-26 |
28.0 |
22.1 |
49.9 |
-21.9 |
48.9 |
17.3 |
33.8 |
15.1 |
| Table 3: Perceptions and Expectations on Price Level |
| (Percentage responses) |
| Survey Round |
Current Perception |
One year ahead Expectation |
| Increased |
Remained Same |
Decreased |
Net Response |
Will Increase |
Will Remain Same |
Will Decrease |
Net Response |
| Jul-25 |
90.3 |
6.4 |
3.3 |
-87.0 |
81.6 |
9.3 |
9.1 |
-72.4 |
| Sep-25 |
89.7 |
7.9 |
2.4 |
-87.3 |
81.0 |
9.1 |
9.9 |
-71.1 |
| Nov-25 |
83.9 |
11.0 |
5.1 |
-78.9 |
78.3 |
12.2 |
9.5 |
-68.8 |
| Jan-26 |
86.3 |
8.6 |
5.1 |
-81.2 |
82.4 |
10.4 |
7.2 |
-75.2 |
| Mar-26 |
89.1 |
6.9 |
4.0 |
-85.2 |
83.2 |
10.2 |
6.6 |
-76.7 |
| May-26 |
91.6 |
7.5 |
0.9 |
-90.7 |
80.5 |
10.5 |
9.0 |
-71.5 |
| Jul-26 |
93.3 |
6.1 |
0.6 |
-92.7 |
82.5 |
10.0 |
7.5 |
-74.9 |
| Table 4: Perceptions and Expectations on Rate of Change in Price Level (Inflation)* |
| (Percentage responses) |
| Survey Round |
Current Perception |
One year ahead Expectation |
| Increased |
Remained Same |
Decreased |
Net Response |
Will Increase |
Will Remain Same |
Will Decrease |
Net Response |
| Jul-25 |
78.7 |
12.5 |
8.7 |
-70.0 |
79.7 |
10.9 |
9.4 |
-70.3 |
| Sep-25 |
77.8 |
14.7 |
7.6 |
-70.2 |
78.0 |
13.0 |
9.1 |
-68.9 |
| Nov-25 |
76.9 |
14.4 |
8.7 |
-68.2 |
75.9 |
16.2 |
7.8 |
-68.1 |
| Jan-26 |
77.6 |
15.6 |
6.8 |
-70.9 |
77.6 |
16.6 |
5.9 |
-71.7 |
| Mar-26 |
78.0 |
16.1 |
5.9 |
-72.2 |
79.6 |
15.5 |
4.9 |
-74.8 |
| May-26 |
81.9 |
13.3 |
4.8 |
-77.1 |
78.6 |
15.9 |
5.5 |
-73.1 |
| Jul-26 |
81.2 |
14.6 |
4.3 |
-76.9 |
79.2 |
15.4 |
5.4 |
-73.8 |
| *Applicable only for those respondents who felt price has increased/price will increase. |
| Table 5: Perceptions and Expectations on Income |
| (Percentage responses) |
| Survey Round |
Current Perception |
One year ahead Expectation |
| Increased |
Remained Same |
Decreased |
Net Response |
Will Increase |
Will Remain Same |
Will Decrease |
Net Response |
| Jul-25 |
22.7 |
56.7 |
20.6 |
2.1 |
57.0 |
38.6 |
4.4 |
52.6 |
| Sep-25 |
27.0 |
49.2 |
23.8 |
3.2 |
59.0 |
35.0 |
6.0 |
53.0 |
| Nov-25 |
26.0 |
51.5 |
22.5 |
3.5 |
59.1 |
34.8 |
6.0 |
53.1 |
| Jan-26 |
26.3 |
50.7 |
23.0 |
3.3 |
57.0 |
36.1 |
6.9 |
50.1 |
| Mar-26 |
25.1 |
52.8 |
22.1 |
3.0 |
55.6 |
37.1 |
7.2 |
48.4 |
| May-26 |
24.1 |
52.8 |
23.1 |
0.9 |
54.9 |
37.3 |
7.8 |
47.1 |
| Jul-26 |
25.0 |
51.9 |
23.1 |
1.9 |
53.6 |
38.6 |
7.8 |
45.8 |
| Table 6: Perceptions and Expectations on Spending |
| (Percentage responses) |
| Survey Round |
Current Perception |
One year ahead Expectation |
| Increased |
Remained Same |
Decreased |
Net Response |
Will Increase |
Will Remain Same |
Will Decrease |
Net Response |
| Jul-25 |
80.2 |
17.7 |
2.2 |
78.0 |
81.0 |
18.0 |
1.0 |
80.0 |
| Sep-25 |
81.4 |
15.7 |
2.9 |
78.5 |
82.1 |
15.0 |
2.9 |
79.1 |
| Nov-25 |
78.7 |
18.6 |
2.6 |
76.1 |
82.2 |
15.1 |
2.8 |
79.3 |
| Jan-26 |
79.7 |
18.6 |
1.7 |
78.0 |
82.3 |
15.4 |
2.3 |
80.0 |
| Mar-26 |
80.2 |
18.1 |
1.8 |
78.4 |
82.8 |
15.7 |
1.6 |
81.2 |
| May-26 |
77.2 |
19.5 |
3.3 |
74.0 |
79.9 |
16.8 |
3.3 |
76.6 |
| Jul-26 |
80.0 |
17.3 |
2.7 |
77.3 |
82.4 |
14.9 |
2.7 |
79.7 |
| Table 7: Perceptions and Expectations on Spending- Essential Items |
| (Percentage responses) |
| Survey Round |
Current Perception |
One year ahead Expectation |
| Increased |
Remained Same |
Decreased |
Net Response |
Will Increase |
Will Remain Same |
Will Decrease |
Net Response |
| Jul-25 |
87.5 |
11.5 |
1.0 |
86.5 |
87.1 |
12.0 |
0.9 |
86.2 |
| Sep-25 |
88.6 |
9.5 |
1.9 |
86.7 |
87.3 |
11.0 |
1.7 |
85.6 |
| Nov-25 |
85.2 |
13.1 |
1.7 |
83.5 |
85.5 |
11.9 |
2.6 |
83.0 |
| Jan-26 |
86.6 |
12.2 |
1.2 |
85.4 |
86.2 |
11.4 |
2.4 |
83.8 |
| Mar-26 |
86.9 |
11.8 |
1.3 |
85.7 |
86.8 |
11.5 |
1.7 |
85.0 |
| May-26 |
86.8 |
11.3 |
1.9 |
84.9 |
85.9 |
11.4 |
2.7 |
83.2 |
| Jul-26 |
88.3 |
10.0 |
1.7 |
86.7 |
87.9 |
10.0 |
2.1 |
85.8 |
| Table 8: Perceptions and Expectations on Spending- Non-Essential Items |
| (Percentage responses) |
| Survey Round |
Current Perception |
One year ahead Expectation |
| Increased |
Remained Same |
Decreased |
Net Response |
Will Increase |
Will Remain Same |
Will Decrease |
Net Response |
| Jul-25 |
37.6 |
25.1 |
37.3 |
0.4 |
43.6 |
27.7 |
28.7 |
15.0 |
| Sep-25 |
35.5 |
30.4 |
34.1 |
1.4 |
39.8 |
35.8 |
24.5 |
15.3 |
| Nov-25 |
30.4 |
40.2 |
29.4 |
1.0 |
40.8 |
36.9 |
22.3 |
18.5 |
| Jan-26 |
30.7 |
39.2 |
30.0 |
0.7 |
40.4 |
36.6 |
23.0 |
17.4 |
| Mar-26 |
29.8 |
41.2 |
29.0 |
0.8 |
42.4 |
36.3 |
21.3 |
21.1 |
| May-26 |
30.4 |
38.5 |
31.1 |
-0.8 |
39.8 |
36.2 |
24.0 |
15.9 |
| Jul-26 |
32.6 |
38.2 |
29.3 |
3.3 |
41.2 |
35.9 |
22.9 |
18.3 |
|