|
Today, the Reserve Bank released the results of its 73rd round of the quarterly Order Books, Inventories, and Capacity Utilisation Survey (OBICUS), which was conducted during Q1:2026-27 and covered 1127 manufacturing companies. The survey1 provides a snapshot of the demand conditions in India’s manufacturing sector during January-March 2026.
Highlights:
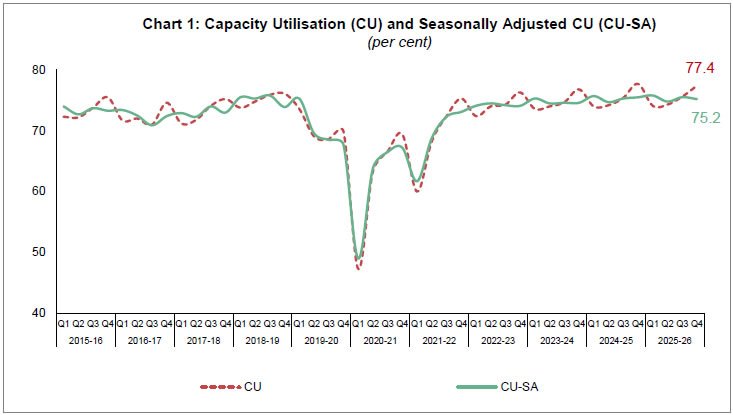
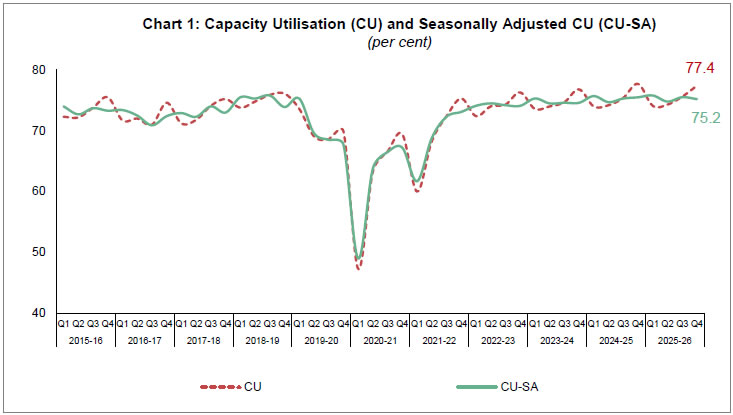
- At the aggregate level, capacity utilisation (CU) in the manufacturing sector increased to 77.4 per cent in Q4:2025-26 from 75.6 per cent in the previous quarter. The seasonally adjusted CU (CU-SA) decreased by 30 basis points from the previous quarter and stood at 75.2 per cent in Q4:2025-26. Both CU and CU-SA for Q4:2025-26 decreased by 30 basis points as compared to their levels in the corresponding quarter of the previous year (Chart 1 and Table 1).
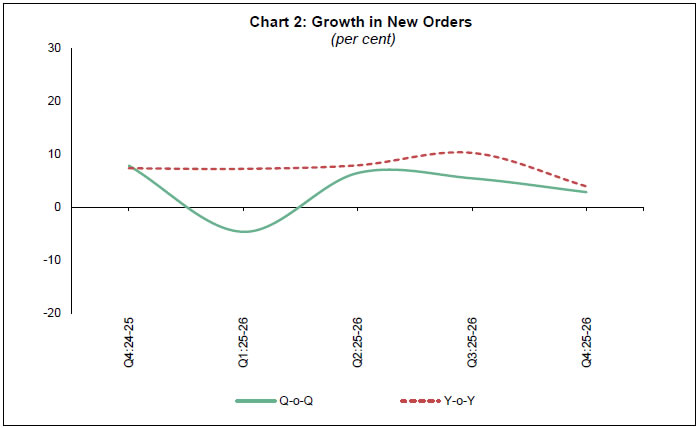
- Manufacturers reported lower growth in new orders during Q4:2025-26 both on an annual (y-o-y) and sequential basis (q-o-q) (Chart 2 and Table 2A).
Note- Please see the excel file for time series data.
ANNEX 1: Data Tables
| Table 1: Capacity Utilisation |
| Quarter |
Number of responding companies |
Capacity Utilisation (per cent) |
Seasonally Adjusted Capacity Utilisation (per cent) |
| Q4:2024-25 |
960 |
77.7 |
75.5 |
| Q1:2025-26 |
887 |
74.1 |
75.8 |
| Q2:2025-26 |
1007 |
74.3 |
74.9 |
| Q3:2025-26 |
980 |
75.6 |
75.5 |
| Q4:2025-26 |
1041 |
77.4 |
75.2 |
| Note: The Seasonally Adjusted Capacity Utilisation is calculated using X13-ARIMA-SEATS (Signal Extraction in ARIMA Time Series) taking the Covid-19 lockdown quarter Q1:2020-21 as an additive outlier. |
| Table 2A: Order Books Growth |
| Quarter |
Number of responding companies |
Q-o-Q Growth # (per cent) |
Y-o-Y Growth # (per cent) |
| Backlog Orders |
New Order Book |
Pending Orders |
Backlog Orders |
New Order Book |
Pending Orders |
| Q4:2024-25 |
353 |
0.7 |
7.9 |
-0.2 |
6.7 |
7.4 |
7.8 |
| Q1:2025-26 |
385 |
-0.3 |
-4.6 |
3.3 |
9.0 |
7.3 |
7.2 |
| Q2:2025-26 |
419 |
2.5 |
6.5 |
-0.7 |
10.7 |
8.0 |
3.3 |
| Q3:2025-26 |
409 |
-0.1 |
5.5 |
2.7 |
-0.1 |
10.3 |
3.9 |
| Q4:2025-26 |
422 |
2.0 |
2.9 |
2.2 |
5.8 |
4.0 |
7.3 |
| #: Growth rates are calculated using common set of companies responding in three survey rounds, namely the current quarter, one quarter ago and the corresponding quarter a year ago. |
| Table 2B: Average Size of Order Books |
| Quarter |
Number of responding companies |
Average Amount (₹ crore) |
| Backlog Orders |
New Order Book |
Pending Orders |
| Q4:2024-25 |
353 |
302.4 |
317.0 |
303.9 |
| Q1:2025-26 |
385 |
331.1 |
324.2 |
342.1 |
| Q2:2025-26 |
419 |
376.1 |
325.9 |
373.9 |
| Q3:2025-26 |
409 |
246.7 |
259.5 |
253.8 |
| Q4:2025-26 |
422 |
306.7 |
299.7 |
330.4 |
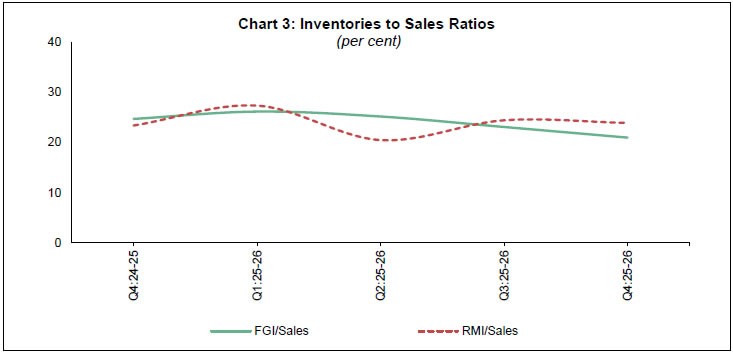
| Table 3A: Inventory to Sales Ratios |
| Quarter |
Number of responding companies |
Ratio (per cent) ## |
| Total Inventory / Sales |
Finished Goods Inventory / Sales |
Raw Material Inventory / Sales |
| Q4:2024-25 |
932 |
66.5 |
24.7 |
23.4 |
| Q1:2025-26 |
894 |
72.1 |
26.2 |
27.4 |
| Q2:2025-26 |
1014 |
61.7 |
25.2 |
20.5 |
| Q3:2025-26 |
987 |
66.7 |
23.1 |
24.5 |
| Q4:2025-26 |
1057 |
62.1 |
21.0 |
23.9 |
| ##: Weighted average of industry level ratios using Gross Value Added as weights. |
| Table 3B: Average Sales and Inventories |
| Quarter |
Number of responding companies |
Average Amount (₹ crore) |
| Sales |
Total Inventory |
Finished Goods Inventory |
Work in progress Inventory |
Raw Material Inventory |
| Q4:2024-25 |
932 |
1309.4 |
508.8 |
187.4 |
111.0 |
156.1 |
| Q1:2025-26 |
894 |
886.5 |
505.1 |
188.2 |
100.2 |
170.9 |
| Q2:2025-26 |
1014 |
1120.1 |
568.2 |
229.4 |
116.4 |
174.1 |
| Q3:2025-26 |
987 |
1181.4 |
535.8 |
190.1 |
122.2 |
178.0 |
| Q4:2025-26 |
1057 |
1396.6 |
577.2 |
200.0 |
128.7 |
200.4 |
Note: The methodology for computations of order book growth and inventory to sales ratios is given in the RBI press release dated October 8, 2021 (link: https://www.rbi.org.in/Scripts/PublicationsView.aspx?id=20650). Please also see footnote 2 on direct estimation of RMI since 53rd round of the survey.
|